You might know a few ways to create charts with pure CSS. Some of them are covered here on CSS-Tricks, and many others can be found on CodePen, but I haven’t seen many examples of “area charts” (imagine a line chart with the bottom area filled in), particularly any in HTML and CSS alone. In this article, we’ll do just that, using a semantic and accessible HTML foundation. Let’s start with the HTML To simplify things, we will … Read article “How to Make an Area Chart With CSS”
The post How to Make an Area Chart With CSS appeared first on CSS-Tricks. You can support CSS-Tricks by being an MVP Supporter.
Inicia sesión para agregar comentarios
Otros mensajes en este grupo.
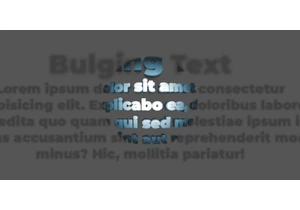
In this third and final chapter, we’re stepping into interactivity by adding JavaScript, starting with a simple :hover effect, and ending with a fully responsive bulging text that foll

In this chapter, we will explore ways to animate the effect, add transitions, and play with different variations. We will look at how motion can enhance depth, and how subtle tweaks can create a wh

A client asked me to create a bulging text effect. With a bit of cleverness and some advanced CSS, I managed to get a result I’m genuinely proud of, which is covered in this three-part series.


