Hi HN! We’re Dori, John, and Ellen from Thorntale https://www.thorntale.com/, a new tool for making data driven presentations. We make it easier for product, engineering, and data teams to communicate their work. Here’s a video demo: https://youtu.be/yLCIo3jG2GM, and you can try it now at https://app.sandbox.thorntale.com without signing in.
Why? Because one of us (the data scientist) kept asking the other (a backend engineer) to move metrics from ClickHouse and CockroachDB, to Snowflake, to Looker, and then to Excel, so that she could make a chart in Excel for the BizOps team to screenshot, and finally stick in Google Slides. Besides being annoying for everyone, this produces inconsistencies and inaccuracies between the actual data and what got presented. We wasted three peoples’ time tracking down queries, going back and forth, and reformatting the same information. We’re building something that can replace PowerPoint/Google Slides for this kind of recurring presentation, with direct data connections and native charting, so that we can all stop screenshotting.
Here are some example presentations:
- A postmortem report: https://app.thorntale.com/report/Postmortem-Template-1755293...
- A product weekly OKR update: https://app.thorntale.com/report/Weekly-Product-OKR-Update-8...
- An exoplanet analysis: https://app.thorntale.com/report/Exoplanet-Analysis-demo-rep...
Thorntale has direct data connections and native charting, eliminating the need for screenshotting or pixel pushing. Currently, we can connect to and visualize data from Google Sheets, Snowflake, and Postgres, with plans to add more source types. We can create or update decks for recurring meetings (like weekly product updates) in minutes instead of hours, and our charts can be re-segmented to answer questions mid-presentation, instead of as a followup days later.
Another thing we’re trying to fix is the need to write a report in a document, only to recreate that report later in a slide deck. This is duplicate work, and splits what should be a single point of truth. Every Thorntale report is actually both a presentation and a document, in one. You can write your long version, choose which points are the most important, and include only those points in the presentation view. When people go back to read your work later, they can see the full context you started with. Try it with the /reportonly command in the tool.
We have grand plans for more — dbt support, more datasource connectors, direct embedding from BI tools like Looker and Tableau, contextual search, and more graph types — but right now we’ve got an early beta. You can check out our sandbox at https://app.sandbox.thorntale.com. Some features are restricted in sandbox mode, but if you like it, we’ve also got free and open signups at https://app.thorntale.com.
We’re really excited to share this with you all, and looking forward to your comments and feedback!
Comments URL: https://news.ycombinator.com/item?id=39854921
Points: 8
# Comments: 0
Connectez-vous pour ajouter un commentaire
Autres messages de ce groupe
![The formation and revision of intuitions (2023) [pdf]](data:image/png;base64,iVBORw0KGgoAAAANSUhEUgAAAQAAAAEACAYAAABccqhmAAAACXBIWXMAAA7EAAAOxAGVKw4bAAAEk0lEQVR4nO3cMUpcawCG4V+5RgKKiQQsZCoRm2wgWCSkSJfCBYirSJ8sQRfgAmxchtuwEhQUwU4YcusLN5CbZDxy3+epD//5mnlnTnFm6e7u7vsAkpanHgBMRwAgTAAgTAAgTAAgTAAgTAAgTAAgTAAgTAAgTAAgTAAgTAAgTAAgTAAgTAAgTAAgTAAgTAAgTAAgTAAgTAAgTAAgTAAgTAAgTAAgTAAgTAAgTAAgTAAgTAAgTAAgTAAgTAAgTAAgTAAgTAAgTAAgTAAgTAAgTAAgTAAgTAAgTAAgTAAgTAAgTAAgTAAgTAAgTAAgTAAgTAAgTAAgTAAgTAAgTAAgTAAgTAAgTAAgTAAgTAAgTAAgTAAgTAAgTAAgTAAgTAAgTAAgTAAgTAAgTAAgTAAgTAAgTAAgTAAgTAAgTAAgTAAgTAAgTAAgTAAgTAAgTAAgTAAg7K+pBzyF+Xw+rq6uxnw+n3rK5F6+fDm2trZ+6tqHh4dxe3u74EXT297eHisrK1PPmEQiADc3N+PTp0/j+vp66imTe//+/Tg/P/+pa8/OzsaXL18WvGh6FxcXY29vb+oZk/AIAGECAGECAGECAGECAGECAGECAGECAGECAGECAGECAGECAGECAGGJtwE3NzfH6enpeHx8XNg9Li8vx7dv38b9/f0vn7GzszO+fv061tbW/uCyf3r16tXCzv43BwcH4/DwcCwtLT3pff+L2Ww29YTJJAKwuro63r17t9B7vHnzZrx48eK3zlhfXx/7+/tP/iFdpNlsNj58+DD1DH7AIwCECQCECQCECQCECQCECQCECQCECQCECQCECQCECQCECQCECQCECQCECQCECQCECQCECQCEJf4SjOmcnJyMk5OTqWeMMcY4PDwcx8fHU894VvwCgDABgDABgDABgDABgDABgDABgDABgDABgDABgDABgDABgDABgDBvA7JQHz9+HJ8/f556xhhjjN3d3aknPDsCwEK9fft2HB0dTT2DH/AIAGECAGECAGECAGECAGECAGECAGECAGECAGECAGECAGECAGECAGECAGECAGECAGECAGECAGECAGECAGECAGECAGECAGECAGECAGECAGECAGECAGECAGECAGECAGECAGECAGECAGFLd3d336ce8X/w+Pg4rq+vx3w+/+UzVldXx9bW1lhefh5dfnh4GLe3t791xsbGxnj9+vUfWsSfJgAQ9jy+aoBJCACECQCECQCECQCECQCECQCECQCECQCECQCECQCECQCECQCECQCECQCECQCECQCECQCECQCECQCECQCECQCECQCECQCECQCECQCECQCECQCECQCECQCECQCECQCECQCECQCECQCECQCECQCECQCECQCECQCECQCECQCECQCECQCECQCECQCECQCECQCECQCECQCECQCECQCECQCECQCECQCECQCECQCECQCECQCECQCECQCECQCECQCECQCECQCECQCECQCECQCECQCECQCECQCECQCECQCECQCECQCECQCECQCECQCECQCECQCECQCECQCECQCECQCE/Q05/VhVzTLhdgAAAABJRU5ErkJggg== "The formation and revision of intuitions (2023) [pdf]")
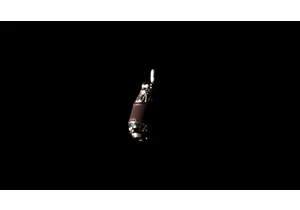
Article URL: https://www.space.com/astroscale-adras-j-space-junk-rendezvous-mission-photo
Comments
Article URL: https://www.svgviewer.dev
Comments URL: https://news.ycombinator.com/item?id=401
 is hiring a Back end Engineer (remote)")
Article URL: https://jobs.ashbyhq.com/fathom.video/50323c12-96b2-4e6a-b8ea-98f21ea6e960
Comments URL


