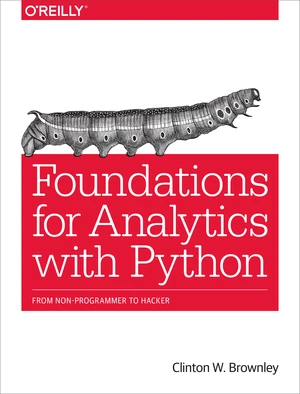
If youâre like many of Excelâs 750 million users, you want to do more with your dataâlike repeating similar analyses over hundreds of files, or combining data in many files for analysis at one time. This practical guide shows ambitious non-programmers how to automate and scale the processing and analysis of data in different formatsâby using Python. After author Clinton Brownley takes you through Python basics, youâll be able to write simple scripts for processing data in spreadsheets as well as databases. Youâll also learn how to use several Python modules for parsing files, grouping data, and producing statistics. No programming experience is necessary. Create and run your own Python scripts by learning basic syntax Use Pythonâs csv module to read and parse CSV files Read multiple Excel worksheets and workbooks with the xlrd module Perform database operations in MySQL or with the mysqlclient module Create Python applications to find specific records, group data, and parse text files Build statistical graphs and plots with matplotlib, pandas, ggplot, and seaborn Produce summary statistics, and estimate regression and classification models Schedule your scripts to run automatically in both Windows and Mac environments
Price history
▲124.08%
Jan 27, 2022
€33.47
▲1.4%
Jan 24, 2022
€14.94
▲1.78%
Jan 17, 2022
€14.73
▲0.06%
Jan 11, 2022
€14.47
▼-0.71%
Jan 10, 2022
€14.46
▲1.31%
Jan 4, 2022
€14.57
▲0.42%
Dec 28, 2021
€14.38
▼-1.48%
Dec 21, 2021
€14.32
▲0.06%
Dec 14, 2021
€14.53
▲0.71%
Dec 13, 2021
€14.52

