As the name suggests, overlapping charts visualize two different sets of data in a single diagram. The idea is that the overlapping bars allow us to compare data, say, year-over-year. They are also useful for things like tracking progress for …
Overlapping Bar Charts originally published on CSS-Tricks, which is part of the DigitalOcean family. You should get the newsletter.
Autentifică-te pentru a adăuga comentarii
Alte posturi din acest grup

Gathered notes on Liquid Glass, Apple’s new design language that was introduced at WWDC 2025. These links are a choice selection of posts and resources that I've found helpful for understanding the


Layout. It’s one of those easy-to-learn, difficult-to-master things, like they say about playing bass. Not because it’s innately difficult to, say, place two elements next to each other

I was playing around with scroll-driven animations, just searching for all sorts of random things you could do. That’s when I came up with the idea to animate main headings and, using scroll-driven

This is the fourth post in a series about the new CSS shape() function. So far, we’ve covered the most common commands y
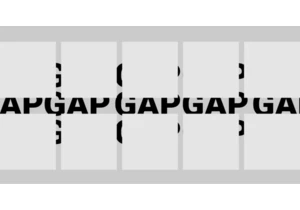
Styling the space between layout items — the gap — has typically required some clever workarounds. But a new CSS feature changes all that with just a few simple CSS properties that make it easy, ye
