How hot is your PC’s graphics card temperature? During normal operations, your GPU temperature shouldn’t matter much—your graphics card should simply drive monitors and play games without overheating and shutting down. But if you have an older PC, a case with poor airflow, or if you want to try your hand at graphics card overclocking, being able to monitor your GPU temperature is vital—especially when the summer heat is scorching indoors and out. There’s a reason that “may your temperatures be low” is a common saying among PC enthusiasts.
The good news? Checking your PC’s graphics card temperature is dead simple, especially now that Windows includes a native way to keep tabs on temps after decades of neglect. All sorts of free GPU monitoring tools are also available, and many of them can help you check your PC’s CPU temperature, too.
Let’s dig in.
How to check your graphics card temperature

You can now find your discrete GPU’s temperature in the Windows 10 Task Manager.
Microsoft finally answered our prayers with the Windows 10 May 2020 Update, adding a GPU temperature monitoring tool in the Task Manager. Sure, it took 24 years, but it’s here now!
To see how hot your graphics card is running, open the Task Manager by pressing Ctrl + Shift + Esc, by pressing Crtl + Alt + Delete and selecting Task Manager, or by right-clicking on the Windows Start menu icon and selecting Task Manager. Once you’re in, simply head to the Performance tab and look for your current GPU temperature listed in the GPU section, as shown in the image above. This works only if you have the Windows 10 May 2020 Update or a newer version of Windows installed, including Windows 11; older versions lack the capability.
It’s a bare-bones feature, showing only the current temperature rather than tracking it over time. It can also be annoying to keep Task Manager open while you’re gaming or fine-tuning an overclock. While we’re very glad to see the option finally included in Windows itself, third-party tools offer more robust GPU temperature options. Read on for alternatives if you need more oomph.
Other GPU temperature monitoring tools

AMD’s Radeon RX 6900 XT.
If you’re running an AMD Radeon graphics card with an up-to-date version of the Radeon Settings app, keeping tabs on your graphics card temperature is simple. AMD’s Radeon Overlay provides handy-dandy tools to tweak your game’s visual settings when you summon it. It also includes a Performance Monitoring tool that displays your GPU temperature and other crucial information while you’re playing games.
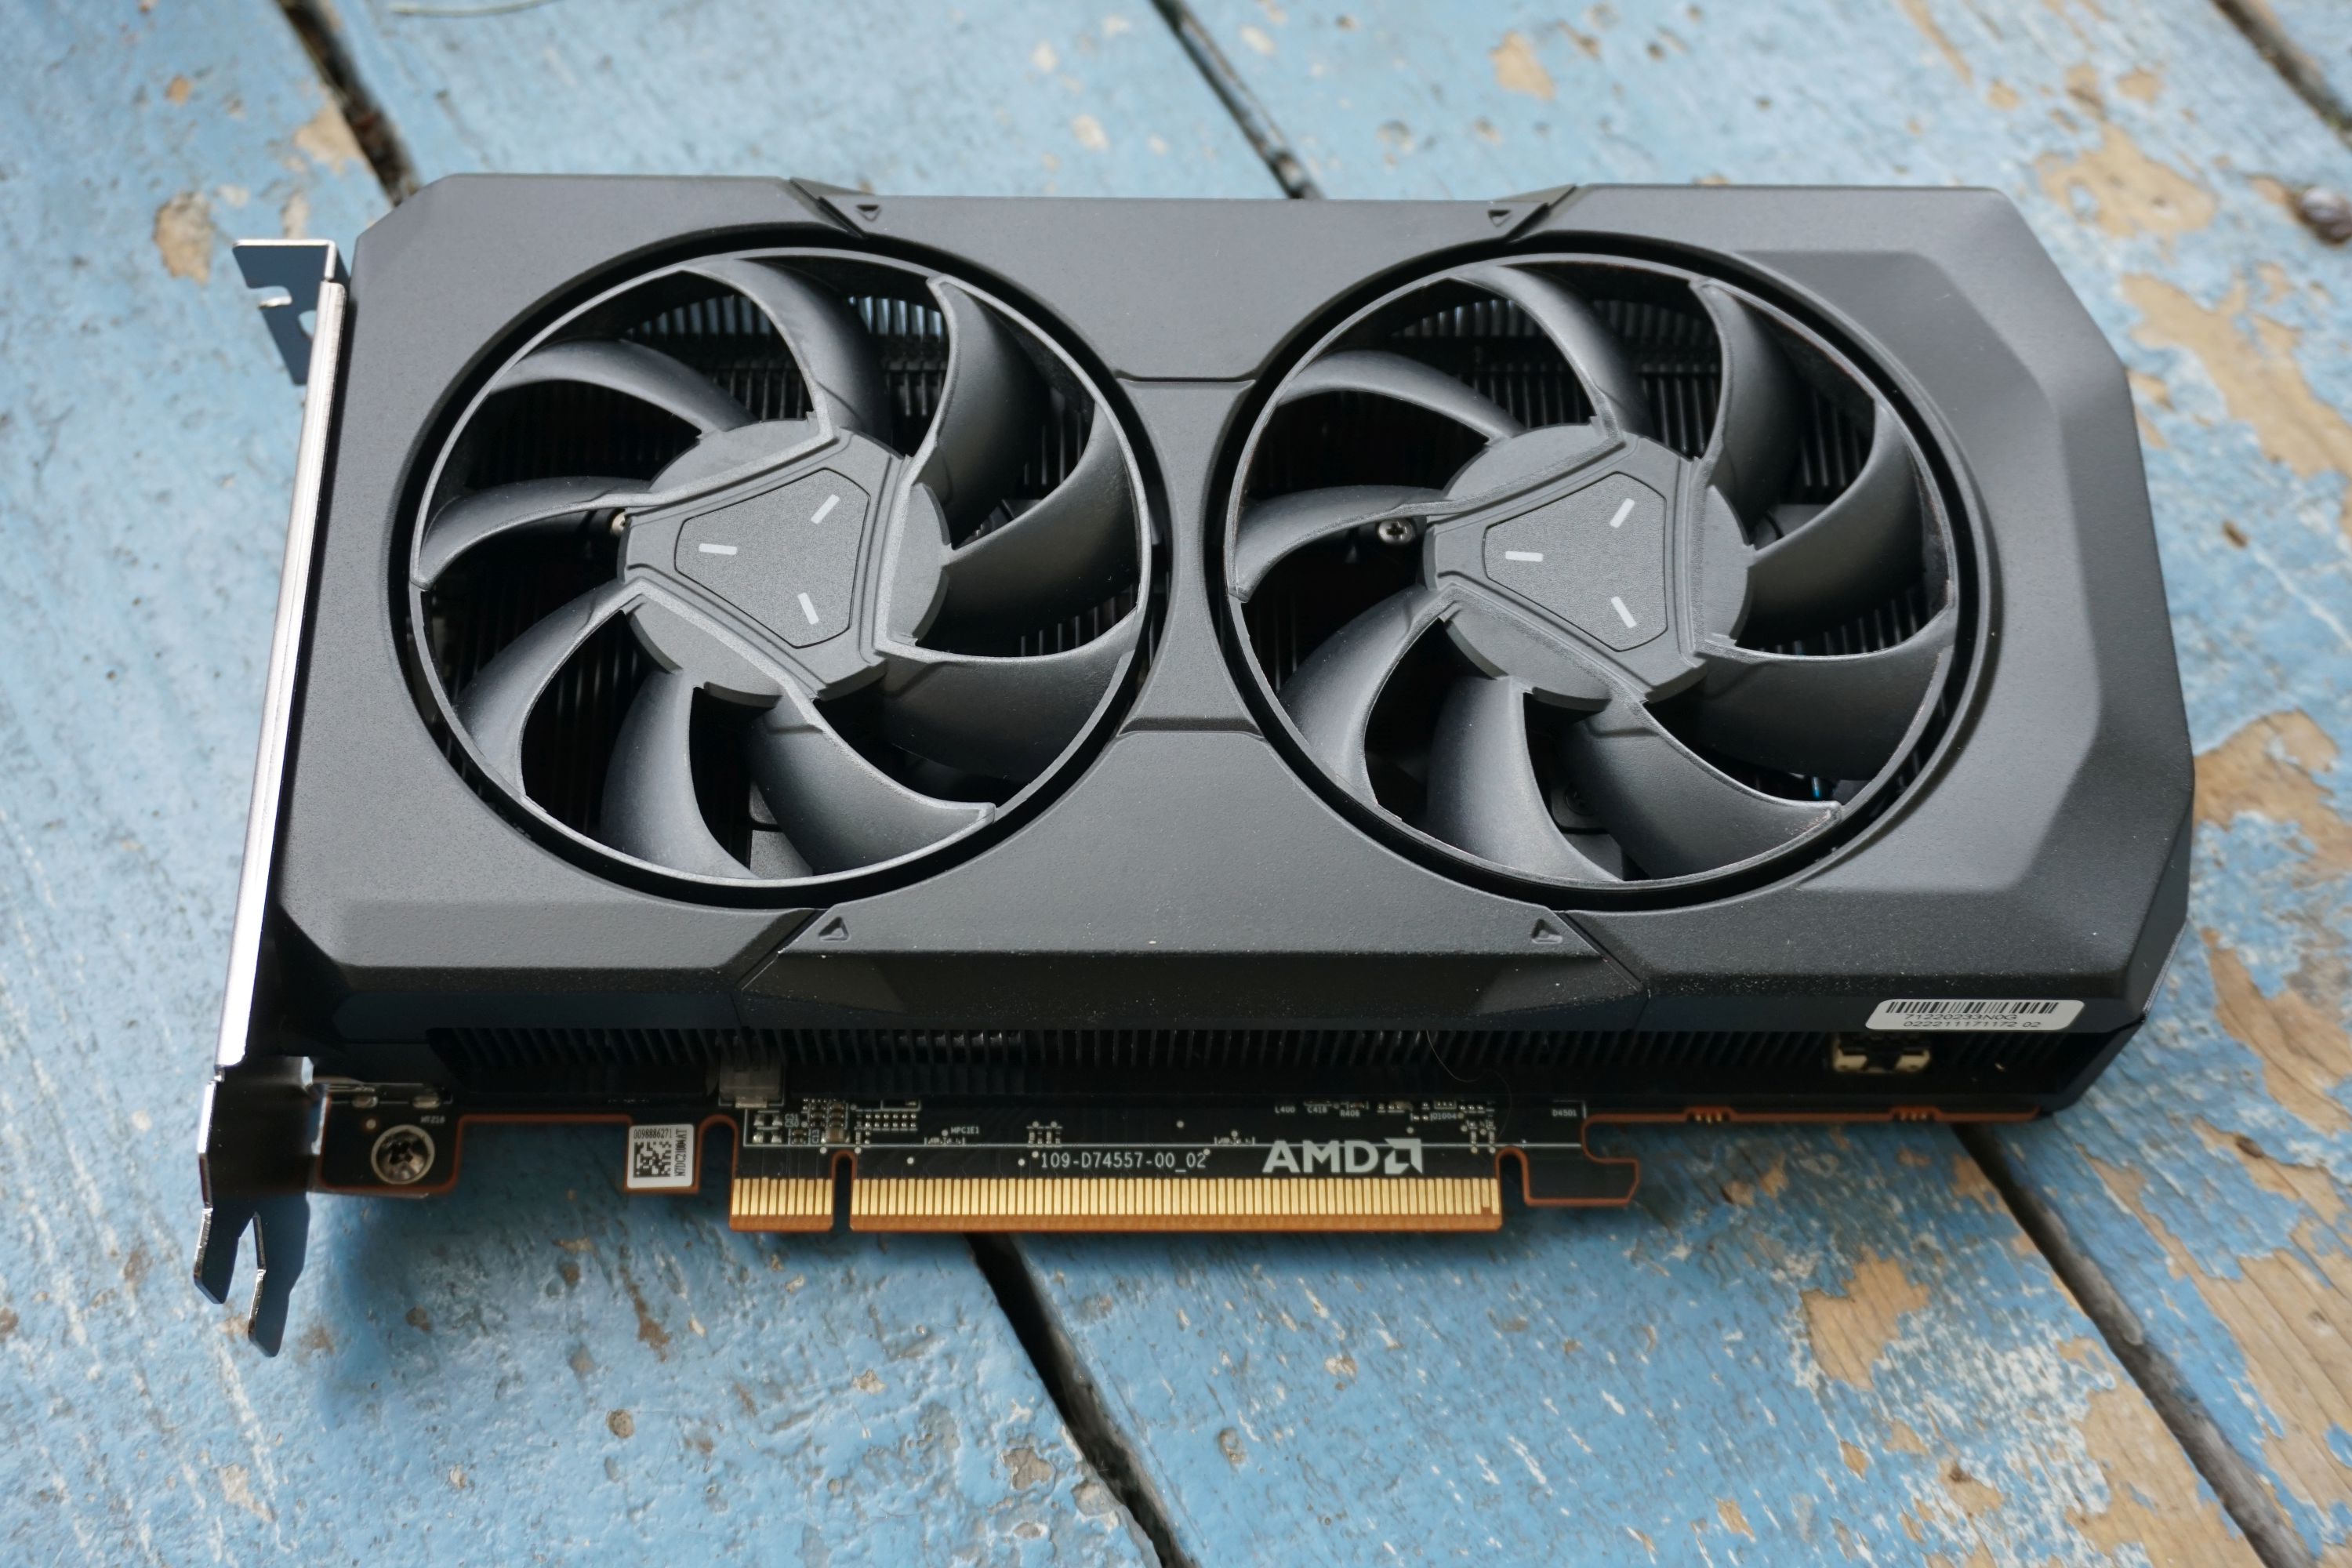
AMD Radeon RX 7600
To activate the tool, summon the Radeon Overlay by pressing Alt + R and select which performance aspects you’d like to keep tabs on in the Overlay’s Performance Monitoring section. Once it’s set up, you can bring up the Performance Monitoring tool alone by pressing Crtl + Shift + 0.
What if you’re not actively playing a game? You can still check your Radeon GPU’s temperature by wading into the Wattman overclocking tool in Radeon Settings. Right-click on the Windows desktop, select Radeon Settings, and then head to Gaming > Global Settings > Global Wattman. After promising not to blow up your graphics card if you apply a wild overclock with the tool, you’ll gain access to Wattman, which tracks GPU temperature and other key statistics in graph form. Done!

The Radeon Overlay’s performance monitoring tool tracks GPU temperature by default.
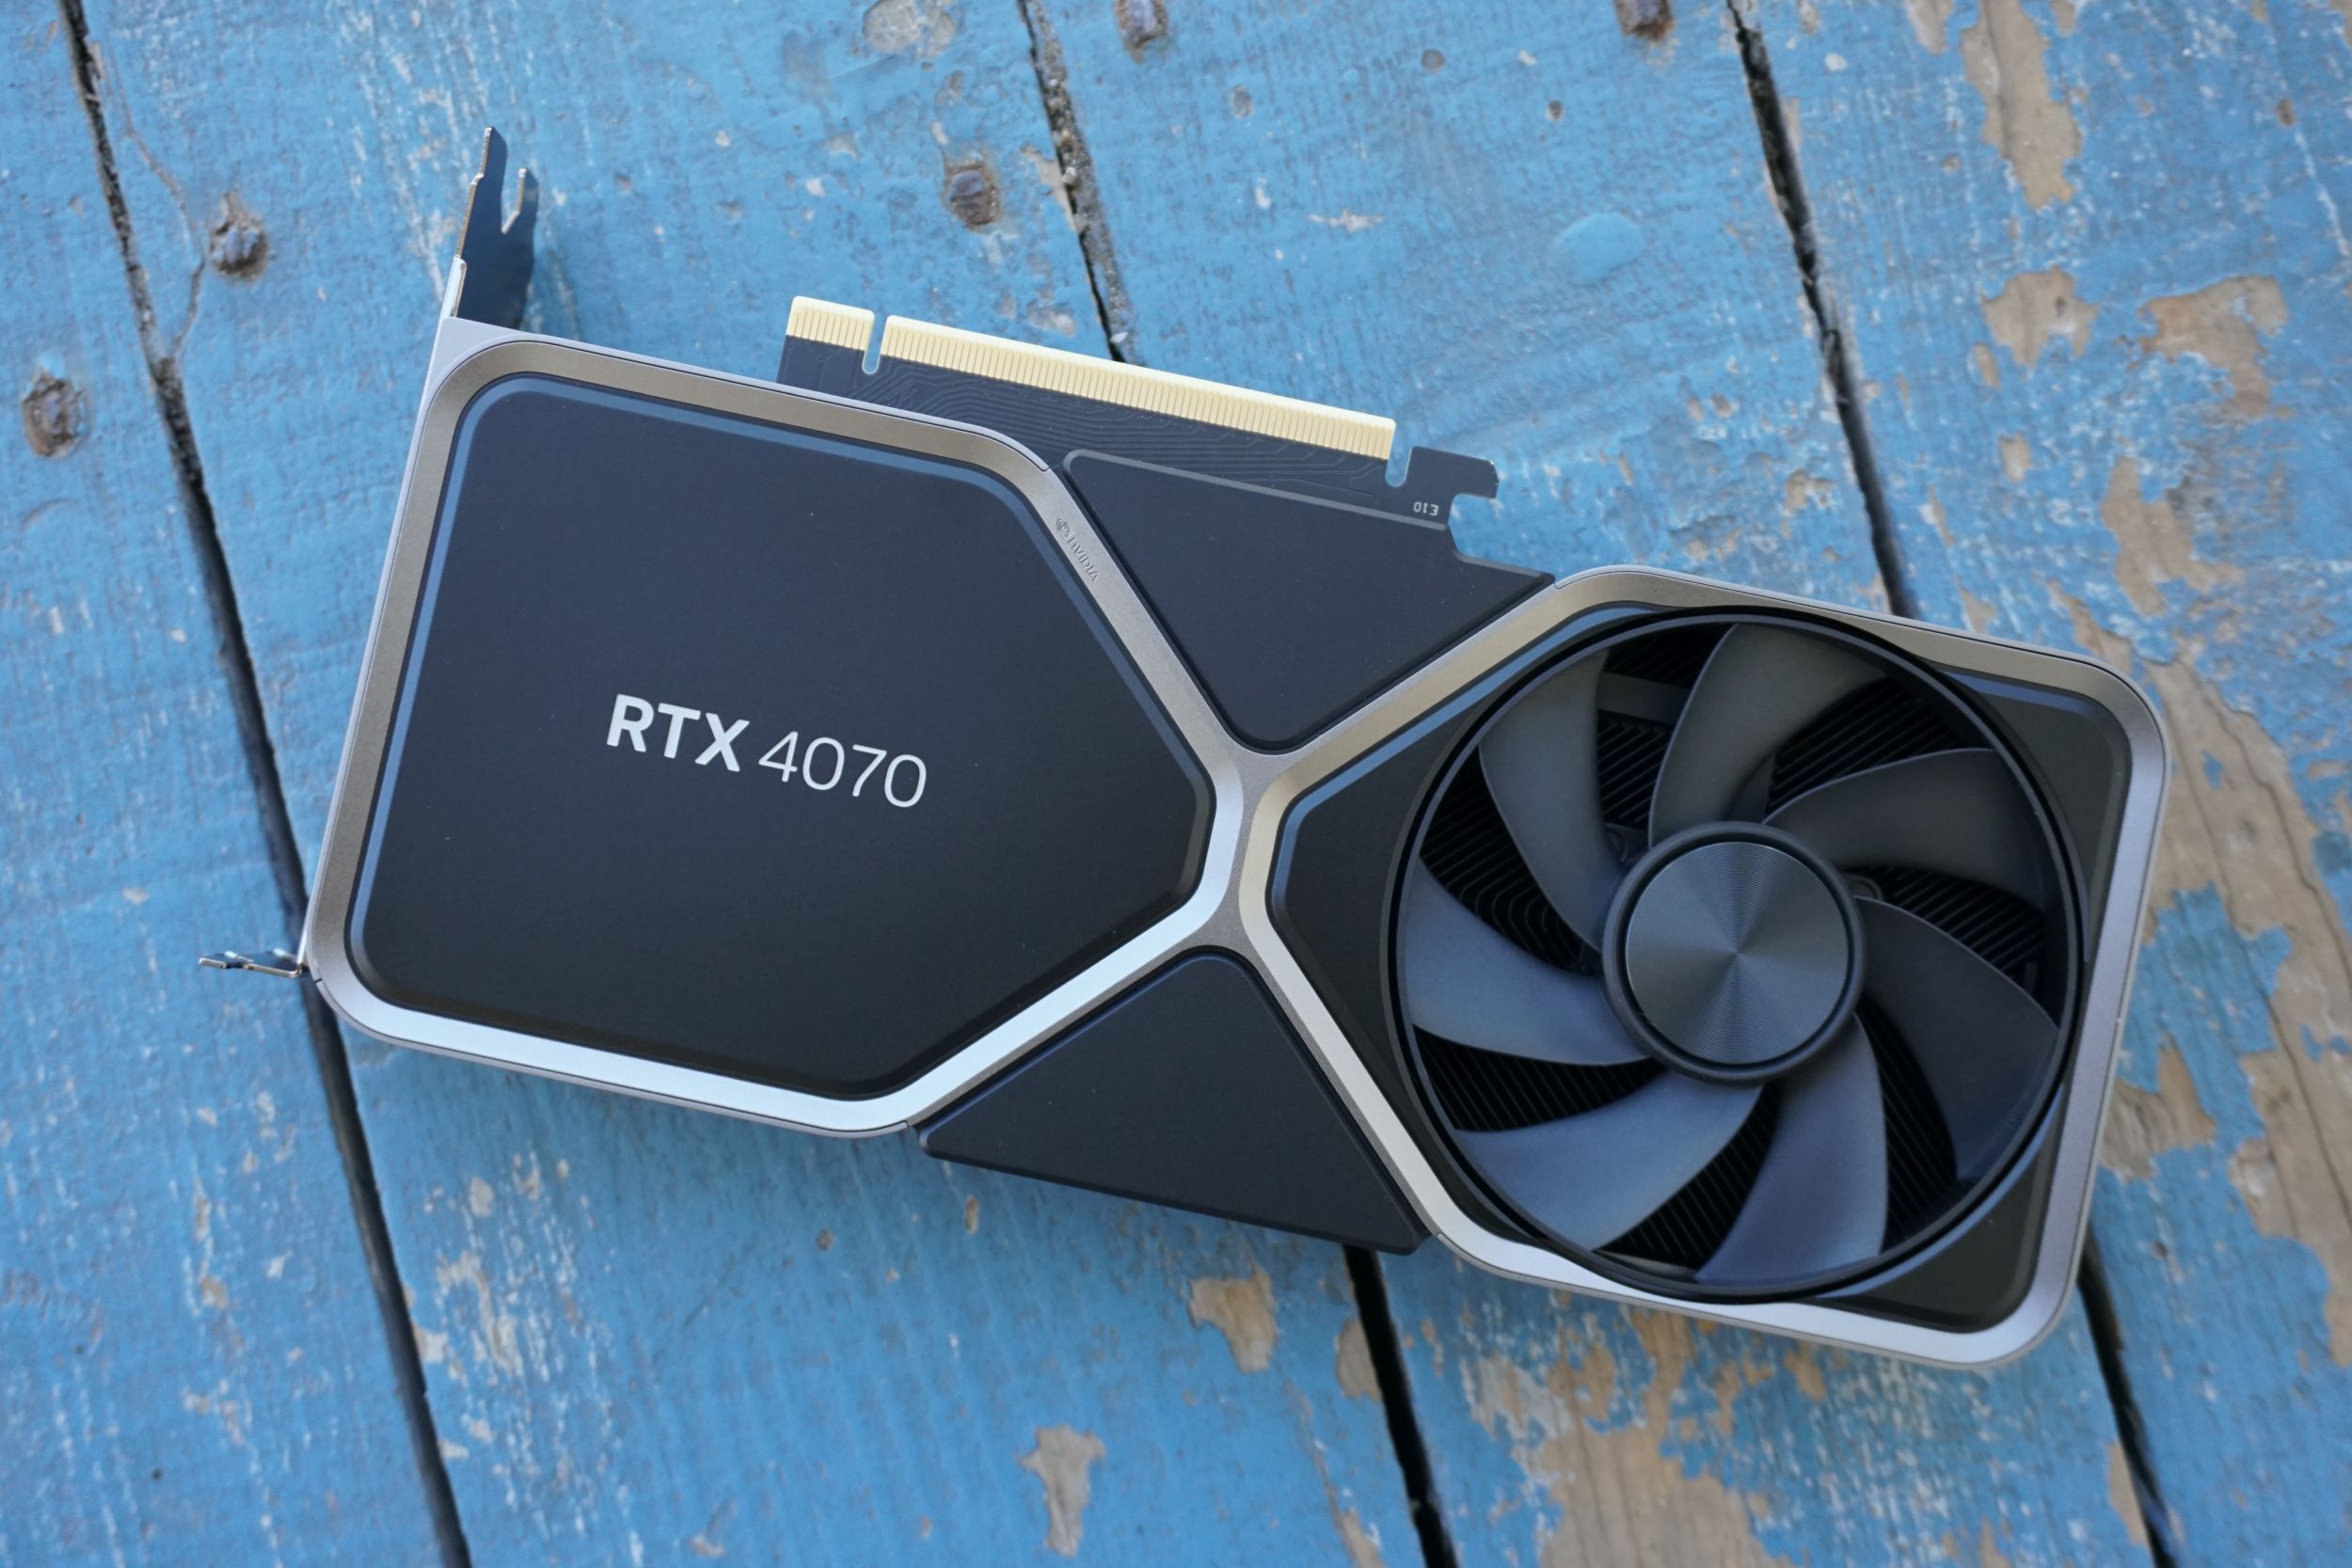
But what if you aren’t packing Radeon hardware? Nvidia’s GeForce graphics comprise a whopping 75 percent of all GPUs in gaming PCs, according to the Steam hardware survey. After years of ignoring performance overlays, Nvidia’s GeForce Experience software now includes those metrics, including the crucial GPU temperature, though it involves jumping through a few more hoops for now.
To enable it, make sure you have GeForce Experience installed. Once it is, open it up, then click the cog icon next to your name to open the Settings. Turn on the “In-game overlay” option.

A screenshot showing how to enable GeForce Experience’s performance overlay.
Click the Settings button, and in the overlay that appears, select HUD Layout > Performance > Advanced, and select where you’d like the overlay to appear on-screen. You’ll see the overlay appear in the chosen place with several metrics visible, including your GPU temperature. Press Alt + R to summon or dismiss GFE’s performance overlay at will once you’ve got it set up.
Many graphics card makers also offer specialized software that enable GPU overclocking. These tools usually include persistent on-screen display (OSD) options that show your graphics card’s most critical measurements, similar to AMD’s Radeon Overlay. Tons are available, but we tend to recommend MSI’s Afterburner tool for its versatility. This long-popular utility works with both Nvidia GeForce and AMD Radeon graphics cards, and provides several additional features gamers will welcome.
Mentioned in this article
You’ll need to dive into the settings options of each of those programs to activate and fine-tune their OSD performance monitoring tools, which prove very helpful indeed when you’re trying to dial in an aggressive overclock. As with AMD and Nvidia’s tools, you can also open Afterburner and Precision X1 outside of games to check your graphics card’s temperature outside of games.
What if you’re not a gamer or don’t care about checking your GPU temperature in-game? Then you’ll want to install hardware monitoring software that taps into your system’s temperature sensors. HWInfo is our go-to monitoring program, because it provides a snapshot of virtually every aspect of your PC (click the Sensors icon to see temps), but SpeedFan and Open Hardware Monitor are solid options, too. Open Hardware Monitor also supports Linux.
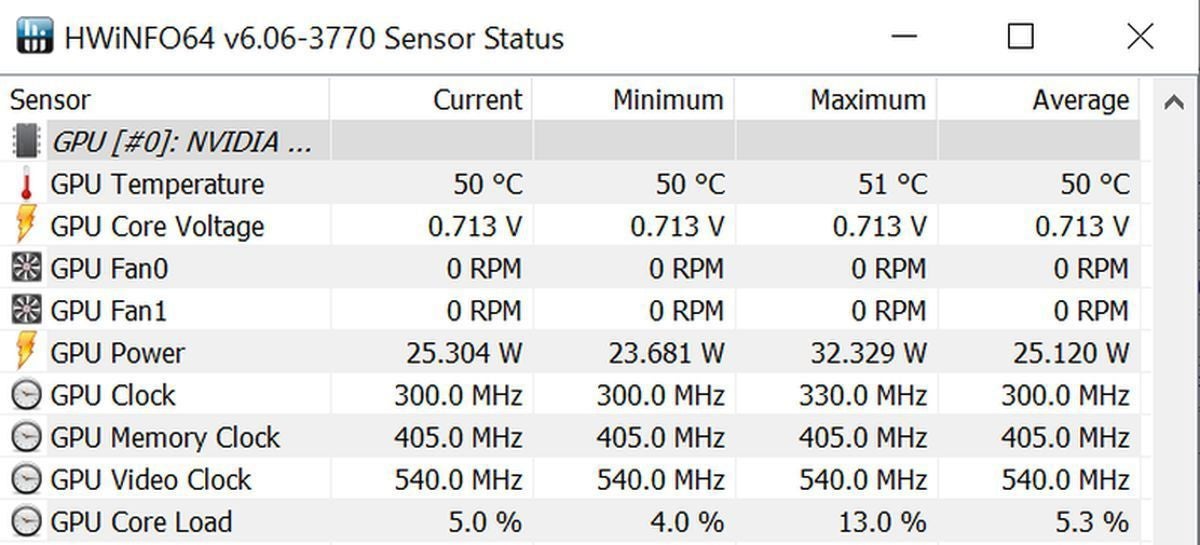
HWInfo’s sensor info includes GPU temperatures and a lot more. A whole lot more.
If the sparse, information-dense look of those enthusiast-focused apps don’t work for you, NZXT’s superb CAM software performs the same task, even if you don’t have any NZXT hardware in your PC. It offers a clean, straightforward aesthetic and a handy mobile app for remote monitoring, but you’ll need to create an account to use CAM.
What’s a good GPU temperature?
So now you know what tools can help you monitor your graphics card temperature, but numbers on a screen mean nothing without context. How hot should your graphics card run?
There’s no easy answer; it varies from GPU to GPU. Google is your friend. Most modern chips can run at temperatures in the mid-90 degrees Celsius, though, and you’ll often see them hit those temperatures in gaming laptops. In desktops, however, a graphics card running at 90-plus degrees is screaming for help. In single-GPU systems with decent airflow, your graphics card temperatures shouldn’t wander above the 80-degree range unless you’re using a model with a single blower-style cooler, or an exceptionally powerful GPU. Custom graphics cards with multiple fans often hover in the 60s and 70s, even under full load, and water-cooled GPUs can run even cooler.

Some graphics cards, like this iteration of the Radeon Vega 64, include integrated closed-loop liquid coolers for even cooler temperatures.
If your graphics card was released in the last five years and runs hotter than 90 degrees Celsius, or you’ve observed a steep incline in your GPU temperature over several weeks or months of monitoring it, consider taking steps
Autentifică-te pentru a adăuga comentarii
Alte posturi din acest grup

TL;DR: Save over 80% on 1min.AI, the all-in-one plat

If you’ve been looking for a good 2-in-1 laptop with a touchscreen bu

Beginning on June 30 of this year, residents in Wyoming are going to

If you’ve been using Windows for a long time, you’ve probably been to