We’ve tested a lot of internal SSDs over the last decade or so, and the improvement to the technology has been astounding. The ongoing advancements in SSDs keep us on our toes and our testing methodology has evolved accordingly. Here’s how it stands at the moment.
What hardware does PCWorld use for testing internal storage?
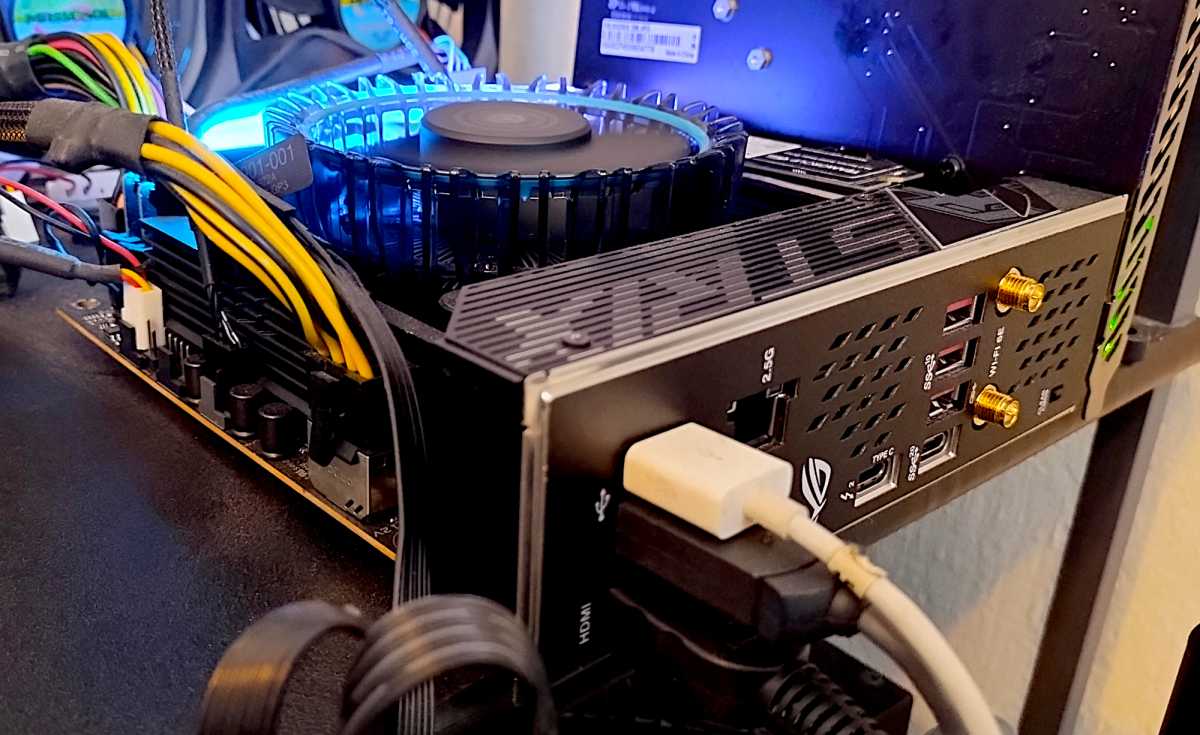
Our current test platform features all of the latest transport technologies: USB 3.2×2 (20Gbps), Thunderbolt 4, PCIe 5.0. There is no discrete USB 4 port, so we test that using the Thunderbolt 4 ports, which do support that protocol.
The operating system is Windows 11 (22H2) 64-bit (updates are disabled) running on an X790 (PCIe 5.0) motherboard/Core i5-12400 CPU combo with two Kingston Fury 32GB DDR5 modules (64GB of memory total). Intel integrated graphics are used rather than a discrete GPU card.
            <div class="scrim" style="background-color: #fff" aria-hidden="true"></div>
    </div></figure></div>
An ImDisk RAM disk using 58GB of the 64GB total system memory is used for the 48GB transfer tests and is allotted 58GB of the 64GB total system memory. The operating system runs off of a Samsung 990 Pro 2TB, which is also the source for larger test files.
While we rarely cover internal hard drives these days, when we do, the same basic test methodology is employed.
What tests does PCWorld run on internal SSDs?
The synthetic benchmarks we consistently employ are CrystalDiskMark 8 (64GB data set) and AS SSD 2 (10GB data set). These have delivered the most consistent results over the years, plus we have a huge library of results that can be directly compared. However, we will also run ATTO and/or IOmeter to check vendor claims of optimization for certain workloads.
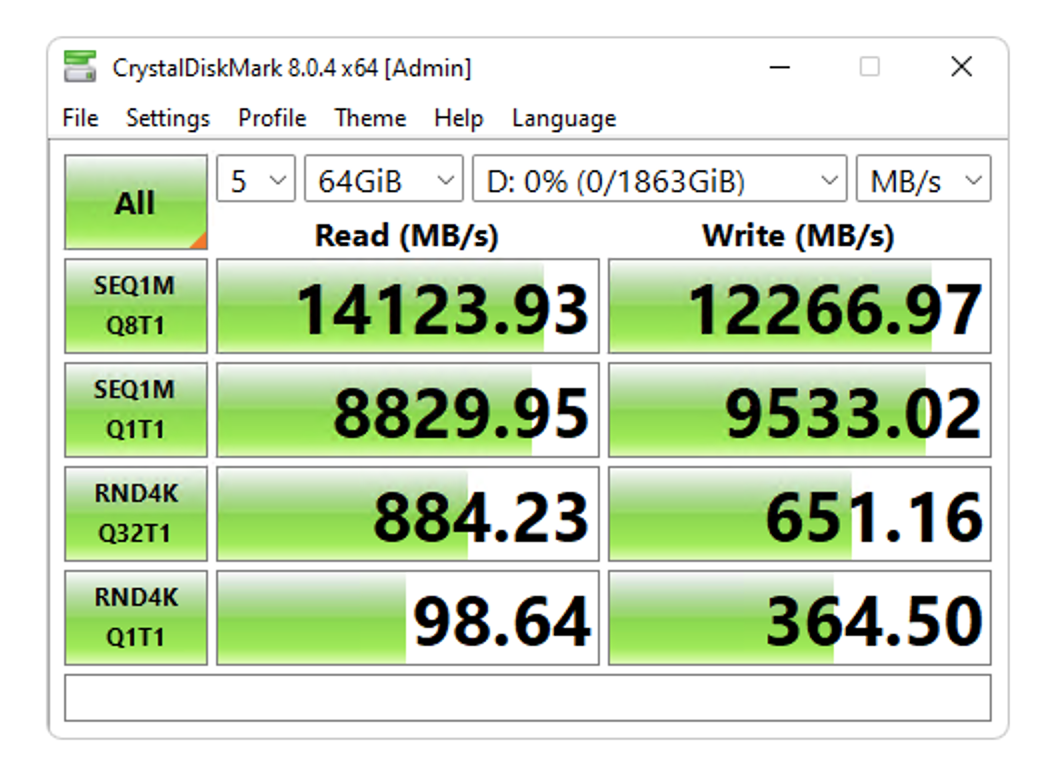
<div class="lightbox-image-container foundry-lightbox"><div class="extendedBlock-wrapper block-coreImage undefined"><figure class="wp-block-image size-full enlarged-image"><img decoding="async" data-wp-bind--src="selectors.core.image.enlargedImgSrc" data-wp-style--object-fit="selectors.core.image.lightboxObjectFit" src="" alt="" class="wp-image-2345197" width="1024" height="771" loading="lazy" /><figcaption class="wp-element-caption">The fastest PCIe 5.0 NVMe SSDs can perform like this on benchmarks, but real-world performance under Window is about a third of this.</figcaption></figure></div> </div></figure></div>The issue with synthetic benchmarks is that, as of late, the numbers they spit out far outstrip anything you’ll see in the real world. That’s not to throw shade on these worthy tools; it’s simply that they do their own I/O. In real life you’re stuck with what Windows provides — which is comparatively primitive in not taking advantage of NVMe’s advanced features such as multiple queues.
So, to mirror what users will see in the progress bars while copying data, we transfer a 48GB set of files and folders as well as a single 48GB file to and from the drive we’re testing. The aforementioned RAM disk is employed as the source for writes and the destination for reads to minimize lag impact on the results.
Alas, NVMe SSDs are approaching the point where they’re almost as fast as main memory, so how much longer a RAM disk will be useful is a concern.
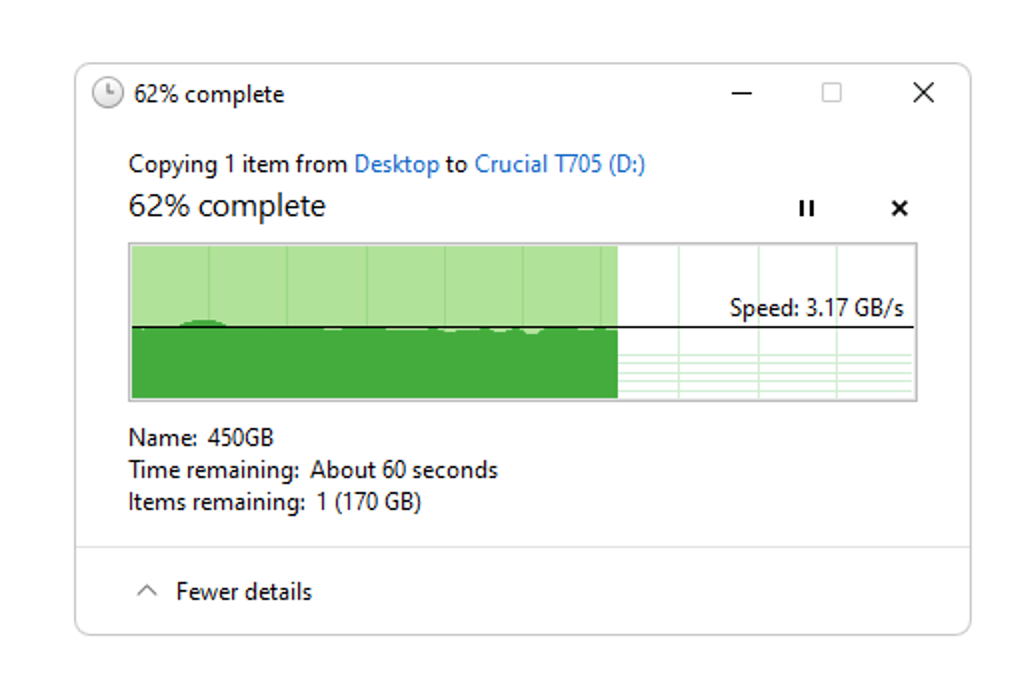
<div class="lightbox-image-container foundry-lightbox"><div class="extendedBlock-wrapper block-coreImage undefined"><figure class="wp-block-image size-full enlarged-image"><img decoding="async" data-wp-bind--src="selectors.core.image.enlargedImgSrc" data-wp-style--object-fit="selectors.core.image.lightboxObjectFit" src="" alt="" class="wp-image-2345198" width="1016" height="690" loading="lazy" /></figure></div> </div></figure></div>We also write a much larger 450GB file; that’s to see how the SSD behaves when it runs out of cache. That my friends, requires a bit of explaining.
How does SSD technology affect PCWorld’s testing?
To comprehend why testing SSDs isn’t as straightforward as kicking the tires of traditional HDDs, tape, optical, etc., you need to understand a bit about the medium.
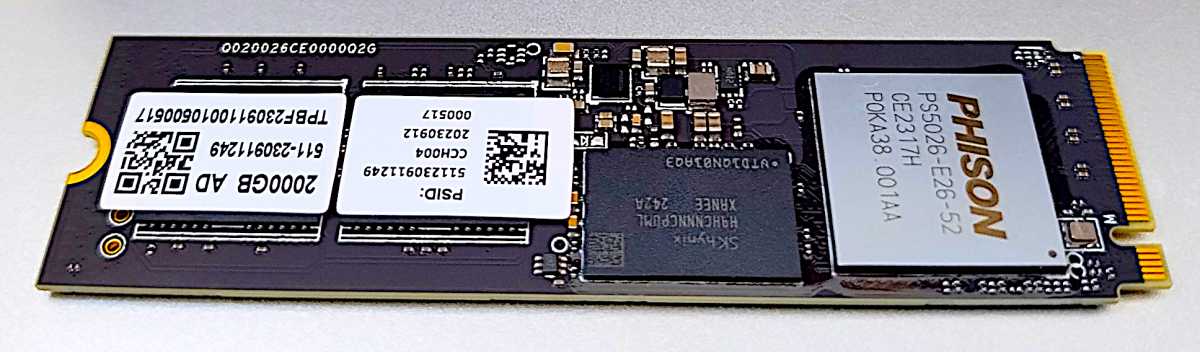
All SSDs use NAND non-volatile memory to store data. This started as simple on/off SLC (Single-Level Cell) NAND with only one voltage level per cell (charged, not charged). However, to increase storage density, NAND evolved to MLC (Multi-Level Cell/2-bit) with four possible voltage levels, then TLC (Triple-Level Cell/3-bit) with eight possible voltage levels, and now sometimes QLC (Quad-Level Cell/4-bit) with 16 possible voltage levels.
The issue with multiple voltage levels is that it takes far longer to make sure the correct voltage was indeed written. This error checking makes denser NAND slow if you write at its native bit depth.
To circumvent this performance road block, SSD controllers will instead allot (fixed or on the fly) a certain portion of NAND to be written as on/off SLC. The SLC blocks are later rewritten natively to other NAND as MLC/TLC/QLC when the drive has time.
Autentifică-te pentru a adăuga comentarii
Alte posturi din acest grup

It ain’t easy to find a deal on a gaming monitor, particularly if you

Time and again, dangerous security vulnerabilities are discovered in

Microsoft has shared a video in which David Weston, who holds the tit


With new AI systems comes new AI vulnerabilities, and a big one was j

Stuck on a boss? Don’t know how to “perfect parry?” Microsoft is addi

Still hanging on to the old Hulu app? If so, it’s probably time to sa
