When it comes to PCs, most users expect a reliable and lag-free experience. The boot up process takes only seconds, programs open almost without delay, and videos run smoothly. But every now and then, there’s sand in the gears: the PC crashes without warning or copying files takes minutes.
In most cases, it’s not the software but the hardware that’s responsible for the drop in performance. But where the bottleneck is located cannot be determined right away. Is a memory module defective or is the CPU overheating? Is the hard disk or SSD working at its capacity limit? Or is the application simply slow because it’s pulling data from the internet?
If your PC is slower than usual, you can find the issue by using special tools that display the current performance of the individual components. Read on to learn more.
Further reading: Is your laptop slow? Try these 9 things before you give up
Using the Task Manager tool is a good starting point
The Windows task manager displays data and statistics on the most important PC components clearly and graphically. In case of problems, this system program is your first port of call.
The Windows task manager displays data and statistics on the most important PC components clearly and graphically. In case of problems, this system program is your first port of call.
IDG
The Windows task manager displays data and statistics on the most important PC components clearly and graphically. In case of problems, this system program is your first port of call.
IDG
<div class="scrim" style="background-color: #fff" aria-hidden="true"></div>
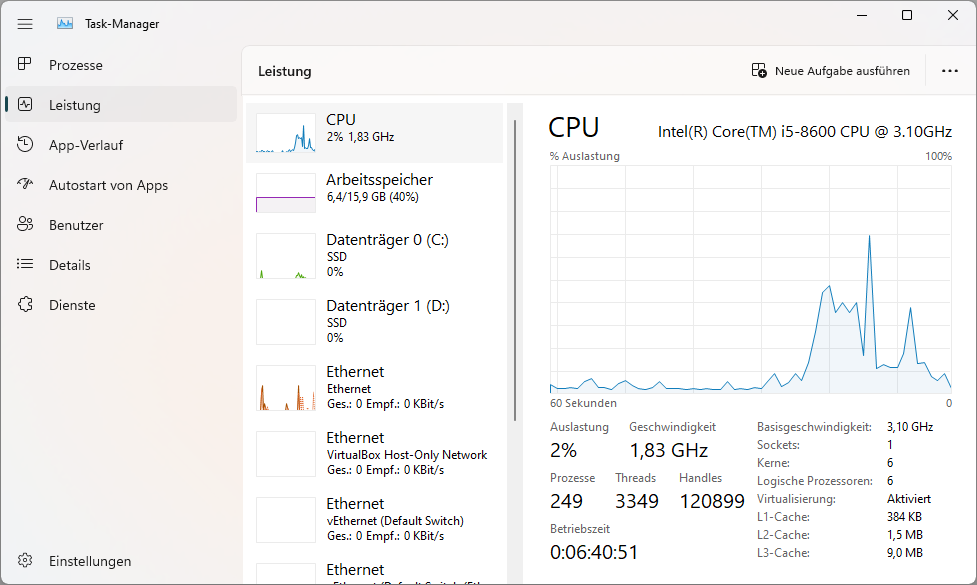
</div></figure><p class="imageCredit">IDG</p></div>The Task Manager is a useful tool for performance control. Microsoft has revised and upgraded the program considerably in recent years.
To call up the task manager, press the keys Ctrl>Alt>Del and select Task Manager (you can also alternatively type task into the Windows search window). In the app, click on Settings at the bottom left and activate the option Always on top.
Now switch to the Performance tab and open the CPU, Memory, GPU, Ethernet, and/or WLAN tabs in turn. Keep the tab open and work as usual on the PC and observe the information of the components. If they are permanently above 80 percent, then there’s something wrong here.
Keeping an eye on the CPU with Core Temp and performance monitoring
The freeware Core Temp shows the current temperatures of the individual CPU cores.
The freeware Core Temp shows the current temperatures of the individual CPU cores.
IDG
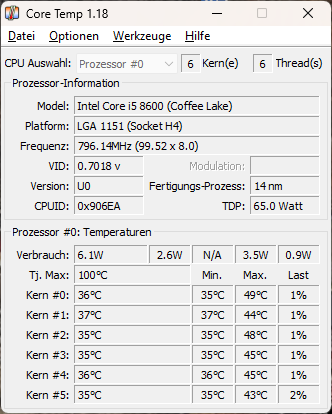
<div class="lightbox-image-container foundry-lightbox"><div class="extendedBlock-wrapper block-coreImage undefined"><figure class="wp-block-image size-full enlarged-image"><img decoding="async" data-wp-bind--src="selectors.core.image.enlargedImgSrc" data-wp-style--object-fit="selectors.core.image.lightboxObjectFit" src="" alt="Die Freeware Core Temp zeigt die aktuellen Temperaturen der einzelnen CPU-Cores an." class="wp-image-1533839" width="332" height="414" loading="lazy" /><figcaption class="wp-element-caption"><p>The freeware Core Temp shows the current temperatures of the individual CPU cores.</p>IDG
</div></figure><p class="imageCredit">IDG</p></div>If your computer crashes again and again or runs noticeably slower, the cause is often an overheated CPU. The trigger can be a badly fitted or malfunctioning fan. The processor’s protection circuit reduces the clock frequency as soon as the temperature rises sharply. If this is not enough, the CPU is deactivated to prevent damage and the PC switches off without warning.
So you’re going to want to check the temperature of the processor with the help of Core Temp. The freeware offers a constantly updated database with all older and current CPU models from AMD and Intel and displays their data after starting. It also calls up the individual core temperatures and displays them on the tool interface and at the bottom of the taskbar.
The program window shows the maximum permissible CPU operating temperature at Tj. Max and the current temperatures below it. If these are permanently above 80 degrees, there’s probably a cooling error. Now you’ll want to look inside the computer to see if the fan is spinning and is firmly seated on the processor.
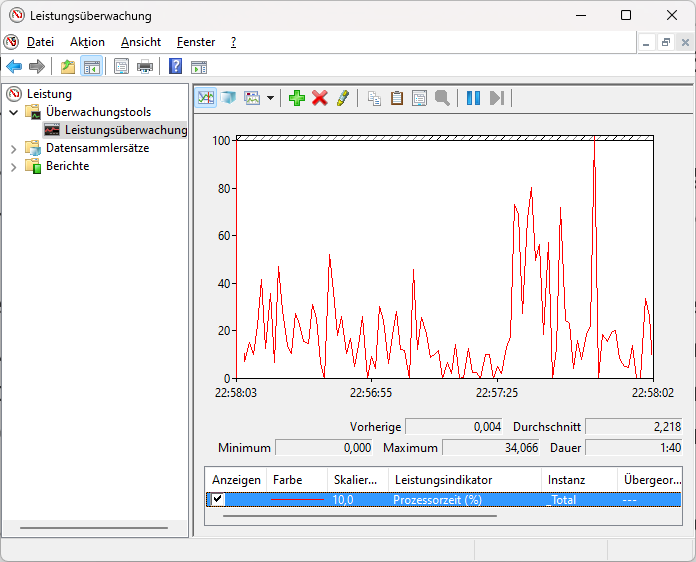
Windows performance monitoring tracks the percentage of processor time required for a thread in the graph (shown below).
Windows performance monitoring tracks the percentage of processor time required for a thread in the graph (shown below).
IDG
<div class="lightbox-image-container foundry-lightbox"><div class="extendedBlock-wrapper block-coreImage undefined"><figure class="wp-block-image size-full enlarged-image"><img decoding="async" data-wp-bind--src="selectors.core.image.enlargedImgSrc" data-wp-style--object-fit="selectors.core.image.lightboxObjectFit" src="" alt="Die Leistungsüberwachung von Windows verfolgt im Diagramm die für einen Thread benötigte Prozessorzeit in Prozent (in der Abbildung unten)." class="wp-image-1533842" width="696" height="562" loading="lazy" /><figcaption class="wp-element-caption"><p>Windows performance monitoring tracks the percentage of processor time required for a thread in the graph (shown below).</p>IDG
</div></figure><p class="imageCredit">IDG</p></div>Autentifică-te pentru a adăuga comentarii
Alte posturi din acest grup

Copilot Vision is one of those Windows features that deserves more at
Over the past several months, the question surrounding Google’s next
You probably already have a trusty flash drive in your office drawer,

With the latest update to Firefox 142, Mozilla is once again introduc
Until now, it was always possible to disable automatic app


Microsoft said Wednesday that it’s working to remove one of the frust
