Built this dashboard to visualize cannabis sales in real time across North America during 4/20. The data updates live from thousands of dispensary POS transactions as the day unfolds.
Under the hood, we’re using Estuary for data streaming and Tinybird to power super fast analytical queries. The charts are made in Tremor and the map is D3.
Comments URL: https://news.ycombinator.com/item?id=43745776
Points: 15
# Comments: 6
Chcete-li přidat komentář, přihlaste se
Ostatní příspěvky v této skupině

Article URL: https://www.audiobookshelf.org/
Comments URL: https://news.ycombinator.com

Article URL: https://www.damninteresting.com/dead-reckoning/

Article URL: https://avalovelace1.github.io/LegoGPT/
Comments URL: https://news
")
Article URL: http://incompleteideas.net/IncIdeas/KeytoAI.html

Article URL: https://github.com/cogentcore/core
Comments URL: https://news.ycombinat
![A Formal Analysis of Apple's iMessage PQ3 Protocol [pdf]](data:image/png;base64,iVBORw0KGgoAAAANSUhEUgAAAQAAAAEACAYAAABccqhmAAAACXBIWXMAAA7EAAAOxAGVKw4bAAAOfElEQVR4nO3d30/V9R/A8dfhx0TJiTjAzWmKtlLENm0SLkcNtXRAIJCutbXVVVvddNG6za0/oLsuuit+nnMURCmxFAYYZkbmgkggFYrFb1J+c87ne2F+p+YPOO/3OQfO6/m4K+X1edXFU/nwOe+Pa3h42BEAKkWFewEA4UMAAMUIAKAYAQAUIwCAYgQAUIwAAIoRAEAxAgAoRgAAxQgAoBgBABQjAIBiBABQjAAAihEAQDECAChGAADFCACgGAEAFCMAgGIEAFCMAACKEQBAMQIAKEYAAMUIAKAYAQAUIwCAYgQAUIwAAIoRAEAxAgAoRgAAxQgAoBgBABQjAIBiBABQjAAAihEAQDECAChGAADFCACgGAEAFCMAgGIEAFCMAACKEQBAMQIAKEYAAMUIAKAYAQAUIwCAYgQAUIwAAIoRAEAxAgAoRgAAxQgAoBgBABQjAIBiBABQjAAAihEAQDECAChGAADFCACgGAEAFCMAgGIEAFCMAACKEQBAMQIAKEYAAMUIAKAYAQAUIwCAYgQAUIwAAIoRAEAxAgAoRgAAxQgAoBgBABSLCfcCkaKvr0+mp6eN5yQlJUl8fLyFjYJrbGxMRkZGwr1G0K1fv16io6PDvUbQEAALRkdHJTc3V7q7u41nffzxx/LRRx9Z2Cq4vvjiC/n000/DvUbQtbe3S0pKSrjXCBq+BbCgvr5eent7rcw6efKkjI6OWpkFPAkBsKC0tFRmZmaszOrs7JSGhgYrs4AnIQCGOjs7paWlxdq8mZkZqaioEMdxrM0EHoUAGDpx4oSMj49bnXnp0iVpb2+3OhN4GAJgYG5uTiorK63/aT0yMiInT560OhN4GAJg4Pvvv5euri7rc/1+v3i9XpmcnLQ+G7gXAQjQ3NyclJeXB21+T0+PnDt3LmjzARECELChoSGpra0N2vyZmRkpKysL2nxAhAAE7NSpUzI2NhbUa9TV1UlfX19QrwHdCEAAbt26JV6vN+jXmZubky+//JIfCSJoCEAAfvvtN7l8+XJIruX1emViYiIk14I+BGCBfD6fuN1umZ2dDcn1Ojs7pbm5OSTXgj4EYIH6+vrku+++C9n1HMeRiooKK580BB7EpwEXqKmpSW7cuBHSa54/f156enpky5YtIb1usL311ltSWFgY7jUea/Xq1eFeIagIwAJMTU2J1+sVv98f0uuOjo5KdXW1fPjhh+JyuUJ67WBKTU2VrKyscK+hGt8CLEB7e7v89NNPYbn26dOnZXh4OCzXRuQiAAtw+vTpsJ2Cc/Xq1bDFB5GLAMzT0NCQ1NTUhO36Pp9PSkpKZG5uLmw7IPIQgHlqbGw0uvkXHx8vcXFxRju0tLTI77//bjQDuBcBmAfHccTtdhud+pOZmWl8x3tgYCConz+APgRgHjo6OuTSpUtGM/Ly8uTIkSNGJ/46jiM1NTUqTuNFaBCAeaitrTW6A7927Vp5+eWXJT09XdLS0ox2uXbtmly4cMFoBnAXAXiCmZkZ8Xg8Rj/7z8rKkpSUFFm1apUcOnTIaJ+pqSlxu90hfxYBkYkAPEFzc7P88ccfAX+9y+WSw4cPS2xsrIiIHDhwQNasWWO004ULF4JyEhH0IQBP4Ha7jZ7DX79+vWRmZv7/nzdt2iQZGRlGOw0NDcmpU6eMZgAiBOCxxsbGpLq62mhGfn6+rFix4v//vGzZMikuLjaa6TiOlJSUWHsXAfQiAI/h8XiMD+YsLi6WqKj7/zdnZmbKxo0bjeb29vZyZiCMEYBHmJqaEo/HYzRjx44dsnXr1v/8+zVr1sj+/fuNZnNmIGwgAI/Q3t5udOpPVFSUFBYW/udPfxGR6OjoR/7aQtTV1clff/1lNAO6EYCHuHvqj8lz90899ZTk5OQ88tfT09MlPT094PkiItPT0+J2uzkzEAEjAA8xODgo33zzjdGM3bt3y6ZNmx7563FxcZKfn290DZE79ylsv5oMehCAh2hqapLr168H/PWxsbFSUFDw2N/jcrmkqKhIYmLMzmT59ddfQ3ZAKSIPAXiAjZt/SUlJkp2d/cTft27dOtm7d6/RtUREysrKQnZIKSILR4I9wMaz9tnZ2ZKcnDyv33v06FFpbGw0ut9w5swZ6e3tfey3HIvRsWPH5NixY+FeQ0REPvjgA/nkk0/CvUbI8TeAB1RXV8utW7cC/vrly5dLXl7evH+/jUeDbTywBJ0IwD36+/ulrq7OaMbmzZtl165d8/79q1atkoMHDxpdU+TOq8qGhoaM50AXAnCPH374wfjEnddee00SEhIW9DV5eXlG5wSI3DkzsLW11WgG9CEA//L5fOL1eo2er09ISJBXX311wV+XkZEhqampAV9XRGR2dlYqKys5MxALQgD+de3aNbl48aLRjEc9+vskd+8bmJ7539zcLJ2dnUYzoAsB+NfZs2fl77//NpqRk5Nz3yf/FsLGzcC+vj45e/as0QzoQgDEziO1ycnJ8sorrwT89du2bZPnn38+4K+/6/jx43L79m3jOdCBAMidJ/+6u7uNZrz00kuyYcOGgL8+Ojpajhw5YvwBoY6ODt4mjHkjACLi9XplYmLCaMa9x34FKiMjw/hhnqmpKamoqDCaAT3UB6C/v9/4++bNmzfLCy+8YLyLrUeDL1y4wM1AzIv6ANTU1Mjo6KjRjH379hnfwBO5c4ZAfn6+LFu2zGjO4OAgZwZiXlQHwHEcqaioEJ/PF/CM6OhoOXz4sERHR1vZafv27cbnBPj9fuM3GUEH1QFoa2szfuNuWlqabN++3dJGIomJiXLgwAHjOd3d3dLY2GhhI0QytZ8G9Pv9Ul5ebvyCjby8POOXfj4oNzdXPvvsM6ODPqanp6WiomJeH0sOl5ycnEWzn+kbm5YqtQG4ffu2nDhxwmiGy+WS4uJi4yf4HrRhwwbZs2eP8c3Jux8QsnF/Ihh27twpb7/9drjXUE1tAM6ePWt8oGZSUpIcP37c0kb3sxGVqakpKS0tlffff996pBAZVAZgcnJSvF6v8Zz+/v5Ff4iE2+2Wd999N+BHlBHZVN4EvHHjhjQ1NYV7jZBoa2uTH3/8MdxrYJFSFwDHcaSqqkrN8/J+v18qKio4MxAPpS4AQ0NDxkd+LzXffvstLxDBQ6kLwOXLl6WtrS3ca4TUwMCA1NbW8gIR/IeqAPh8PvF4PCpPzamurpaxsbFwr4FFRlUAurq6jI/8XqpaW1vll19+CfcaWGRUBaCurk76+vrCvUZYzM7OSklJifGTj4gsagIwPj4uVVVV4V4jrJqbm6Wrqyvca2ARUROAixcvSkdHR7jXCKu+vj7j9x4gsqgJQFVVlfq36DqOIydOnDB68xEii4oA/Pnnn3L+/Plwr7EodHR0GB9/jsihIgA2jvyOFOPj4+L1enkmACKi4MNAfr/fyhtzli9fbnxUlynHcWR8fNz4v6W+vl5u3rwpTz/9tKXNsFRFfACuXr0qV65cMZ7z+eefS25uroWNAjc3NyfvvPOO8Xl/d58MfO+99yxthqUq4r8FqKyslMnJSaMZGzdulBdffNHSRoGLiYmRo0ePGr87wO/3y1dffaXyiUjcL6IDMDU1JR6Px3hOdna2JCYmWtjI3K5du+TZZ581ntPd3a3mI9F4tIgOwJkzZ2RgYMBohsvlksLCQmun/ppKTk6W/fv3G8+Znp6W8vJyCxthKYvYAMzMzEhlZaXxnOeee874mG6bXC6XFBQUWDmI9PTp0zI0NGRhKyxVERuA3t5eqa+vN55j8sbfYNmyZYtkZGQYz+FHgojIADiOI8ePHze++RcVFSWHDx9edAdqxsfHy+uvv25llo2bpFi6IjIAo6OjVl6NtWPHDis33ILh0KFDkpCQYDyHjwnrFpEBuHLlily9etVoRlRUlBQVFVnayL7ExEQ5ePCg8RzHcaSsrIwfCSoVcQGYnZ2V0tJS4+9r4+PjJS8vz9JW9sXExMibb75pZdbXX3+t9pwE7SIuADdv3rTyTrw9e/bIunXrLGwUPJmZmZKammo8Z3BwUGpray1shKUm4gJQV1cn/f39RjNiY2MlPz9/0d38e1BUVJS88cYbVvasrq42fk06lp6ICsA///wjNTU1xn/9T0lJkaysLEtbBVd+fr7Ex8cbz/n555+5GahQRAXAxs0/EZG9e/fK2rVrLWwUfM8884zs3r3beM7dx6Z9Pp+FrbBUREwA7r7xx/TUn7i4uLB/6m8hXC6XFBUVSWxsrPGshoYGuX79uvlSWDIiJgC2Tv3ZuHGjlT9RQyk7O9vK31h6e3vl3LlzFjbCUhExAWhoaJCenh7jOfv27Vs0n/ybr6SkJCsfEHIcRzweD08GKhIRAfD5fFJaWmr8/evKlSslJyfH0lahVVBQICtXrjSe09bWJi0tLRY2wlIQEQFobW218r6/tLQ02bZtm4WNQm/nzp2ydetW4znj4+NWzlDA0uAaHh5e8h8Fm5iYkIGBAeMf/61YsUKSk5MtbRV6/f39MjExYTwnLi7uifcUxsbGZGRkxOg6q1evllWrVhnNgJmICACAwETEtwAAAkMAAMUIAKAYAQAUIwCAYgQAUIwAAIoRAEAxAgAoRgAAxQgAoBgBABQjAIBiBABQjAAAihEAQDECAChGAADFCACgGAEAFCMAgGIEAFCMAACKEQBAMQIAKEYAAMUIAKAYAQAUIwCAYgQAUIwAAIoRAEAxAgAoRgAAxQgAoBgBABQjAIBiBABQjAAAihEAQDECAChGAADFCACgGAEAFCMAgGIEAFCMAACKEQBAMQIAKEYAAMUIAKAYAQAUIwCAYgQAUIwAAIoRAEAxAgAoRgAAxQgAoBgBABQjAIBiBABQjAAAihEAQDECAChGAADFCACgGAEAFCMAgGIEAFCMAACKEQBAMQIAKEYAAMUIAKAYAQAUIwCAYgQAUIwAAIoRAEAxAgAoRgAAxQgAoBgBABT7H8egeY9vkMfMAAAAAElFTkSuQmCC "A Formal Analysis of Apple's iMessage PQ3 Protocol [pdf]")
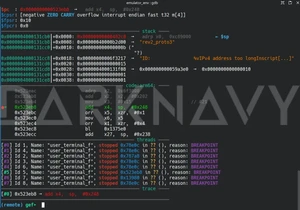
Article URL: https://www.darknavy.org/blog/a_first_glimpse_of_the_starlink_user_ternimal/
Comments
